1
Please refer to important disclosures at the end of this report
1
1
Particulars (` cr)
Q2FY20
Q1FY20
% chg (qoq)
Q2FY19
% chg (yoy)
NII
2,037
1,962
3.8
2,055
-0.9
Pre. Prov. Profit
1,588
1,543
2.9
1,622
-2.1
PAT
765
634
20.6
609
25.6
Source: Company, Angel Research
For Q2FY2020, STFC has reported in-line numbers. For the quarter, PAT
increased 25.6% yoy owing to tax benefit (`170cr), AUM growth continued to be
moderate at 4% yoy vs. 6% in Q1FY2020 and 21% in Q2FY2019. Disbursement
stood at `13,120cr (New Vehicle at `666cr & Used Vehicle at `12,282 cr).
AUM growth moderated; NIM stable: During the quarter, STFC reported
AUM growth of 4% yoy, led by working capital (39% yoy on low base) and
used vehicle loans (6% yoy), while AUM of new vehicles and business
loans declined 14% yoy. The tractor AUM declined 16% yoy in
2QFY2020, However, MLCVs reported a 13% yoy growth. The largest
contributor, HCVs (46% of the book) reported minuscule growth of 2%
yoy. We believe subdued economic growth, delayed infra spending, and
higher LTV impacted AUM growth. NIM remained stable at 8.16% (up
3bps qoq), as the company managed to pass the incremental higher costs
to borrowers
Moderate deterioration in asset quality; credit cost guidance maintained
at 2%: Gross stage 3 increased marginally by 5%/declined 3% qoq /yoy
primarily owing to heavy rain which impacted borrower's business. During
the quarter credit cost jumped to 2.44% vs. 2.11% in Q1FY2020, however,
Management has guided to bring down credit costs to below 2% in the next 1.5
years. We expect Gross stage 3 to improve gradually owing to (a) good monsoon
to improve borrower's financials, (b) strengthening of collection team, (c) with
implementation of BS VI collateral value of used vehicle will get stabile/improve
and consequently LGD would decline.
Outlook & Valuation: We expect STFC’s AUM to grow at CAGR of 11%
over FY2019-21E primarily owing to (1) post-election government to
increase spending on infra project (macro recovery), and (2) pre-buying
of CV before the BS VI and consequently improvement in pricing of older
vehicles to improve asset quality. We expect STFC to report RoA/RoE of
3%/18.3% in FY2021E. At CMP, the stock is trading at 1.2x FY2021E ABV
and 7x FY2021E EPS, which we believe is reasonable for a differentiated
business model with return ratios. We recommend a BUY on the stock
with a Target Price of `1,410.
Key Financials
Y/E March (` cr)
FY17
FY18
FY19
FY20E
FY21E
NII
5,561
6,800
7,808
8,572
9,604
YoY Growth (%)
10.1
22.3
14.8
9.8
12.0
PAT
1,257
2,460
2,562
3,157
3,713
YoY Growth (%)
6.7
95.7
4.2
23.2
17.6
EPS
55
108
113
139
164
Adj Book Value
498
598
698
823
970
P/E
21
11
10
8
7
P/Adj.BV
2.3
1.9
1.6
1.4
1.2
ROE (%)
11.7
19.8
17.4
18.3
18.3
ROA (%)
1.8
2.9
2.5
2.9
3.0
Valuation done on closing price of 29/10/2019
BUY
CMP 1,156
Target Price 1,410
Investment Period 12 Months
Stock Info
Sector
Bloomberg Code
Shareholding Pattern (%)
Promoters 26.3
MF / Banks / Indian Fls 4.8
FII / NRIs / OCBs 60.8
Indian Public / Others 8.2
Abs.(%) 3m 1yr 3yr
Sensex 5.7 16.9 42.9
SHTF 18.6 5.7 8.9
Nifty
11,790
Reuters Code
SRTR.BO
SHTF IN
Face Value (`)
10
BSE Sensex
39,832
52 Week High / Low
1297/909
Avg. Daily Volume
39,217
Beta
1.5
NBFC
Market Cap (` cr)
26,030
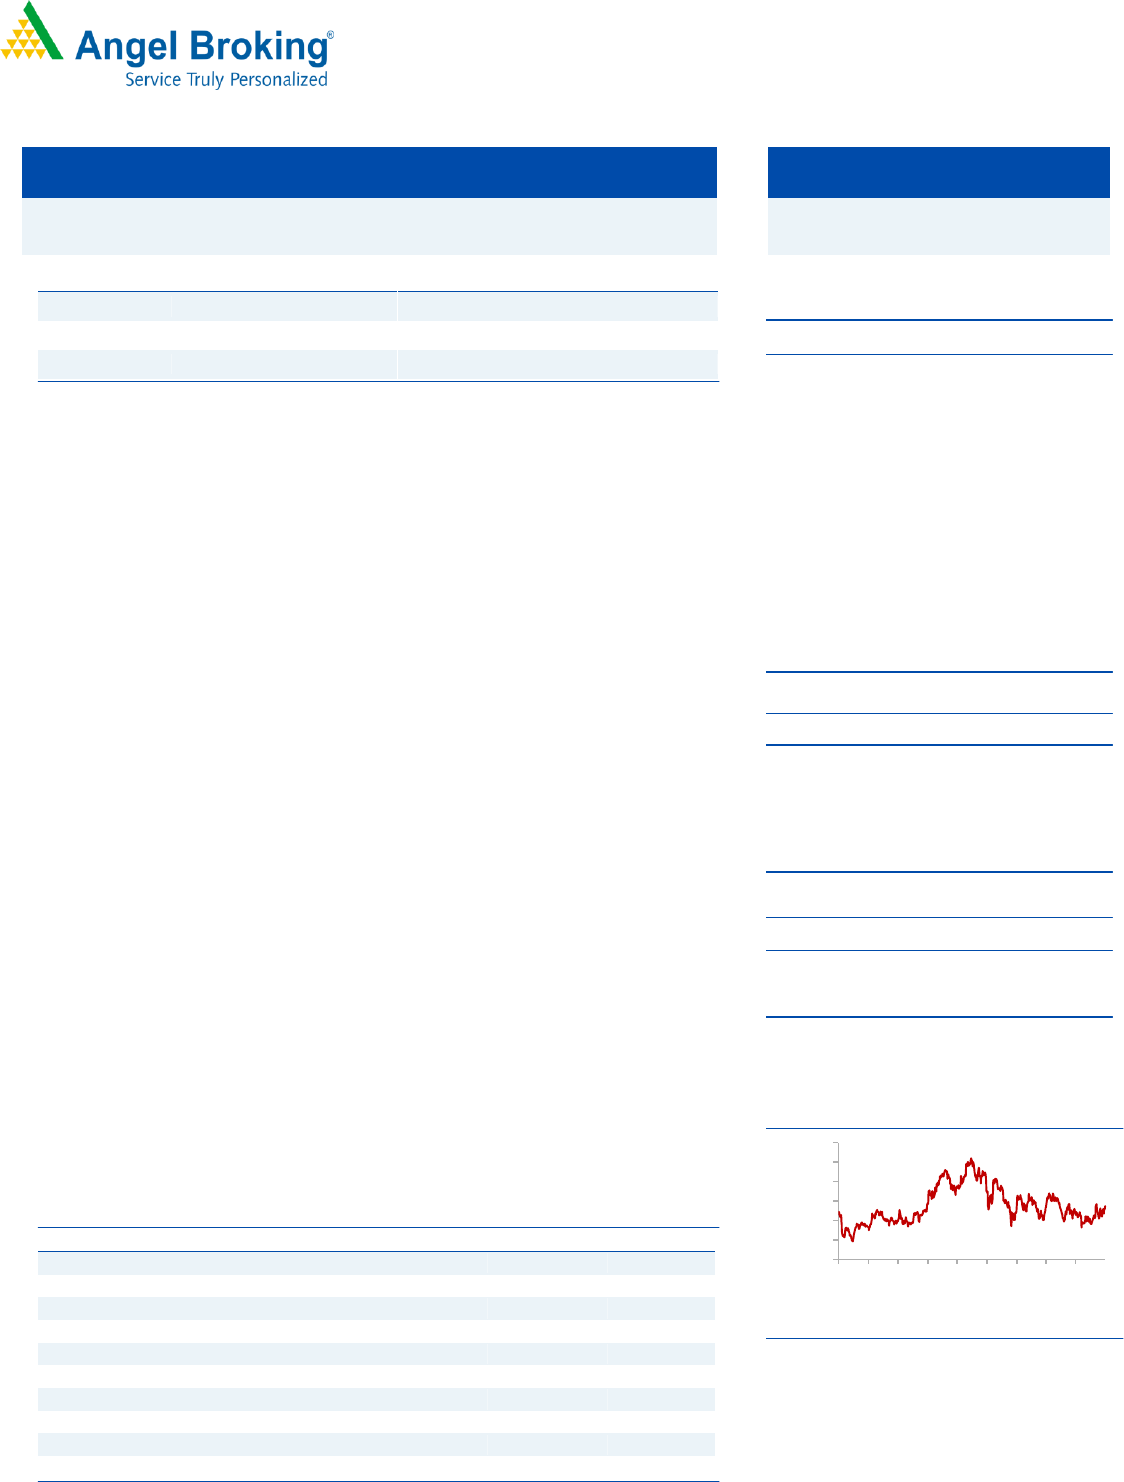
3 Year Price Chart
Source: Company
Jaikishan J Parmar
Research Analyst
022 39357600, Extn: 6810
jaikishan.parmar@angelbroking.com
600
800
1000
1200
1400
1600
1800
Oct-16
Feb-17
Jun-17
Oct-17
Feb-18
Jun-18
Oct-18
Feb-19
Jun-19
Shriram Transport Fin Co
Performance Highlights
Quarterly results | NBFC
Oct 30, 2019
2
Quarterly results | Q2FY2020 Result Update
Oct 30, 2019
2
Exhibit 1: Income Statement
Particular (` cr)
1QFY19
2QFY19
3QFY19
4QFY19
Q1FY20
Q2FY20
% QoQ
% YoY
Total Interest Income
3,712
3,917
3,968
3,845
4,001
4,113
3
5
Interest Expenses
1,889
1,862
1,941
1,939
2,040
2,076
2
12
Net Interest Income (NII)
1,823
2,055
2,027
1,906
1,962
2,037
4
(1)
Other Income
18
24
26
35
27
43
58
78
Total Income
3,729
3,942
3,994
3,880
4,029
4,156
3
5
Net Income
1,841
2,080
2,053
1,941
1,989
2,080
5
0
Operating Expenses
435
458
433
429
446.50
492.60
10
8
Employee Expenses
225
232
222
204
233
251
7
8
Other Operating Expenses
210
226
211
225
213
242
13
7
Operating Profit
1,406
1,622
1,620
1,512
1,543
1,588
3
(2)
Provisions
523
684
636
540
561
661
18
(3)
PBT
883
938
984
972
982
927
(6)
(1)
Provisions for Tax
310
329
348
226
347
162
(53)
(51)
Tax Rate %
35.1
35.1
35.4
23.3
35.4
17.5
PAT
573
609
635
746
634.2
765.1
21
26
Source: Company, Angel Research
Exhibit 2: Quarterly performance
AUM Mix (%)
1QFY19
2QFY19
3QFY19
4QFY19
Q1FY20
Q2FY20
% QoQ
% YoY
New CV Loans
13
13
12
12
11.4
10.7
(66.4)bp
(212.7)bp
Used CV loans
87
87
88
88
88.6
89.3
66.4bp
212.7bp
Profitability
Cal Nim
7.45
8.02
7.79
7.32
7.44
7.60
15.4bp
(42.6)bp
NIM
7.52
7.44
7.22
7.16
7.16
7.19
3bp
(25)bp
C/I
23.6
22.0
21.1
22.1
22.4
23.7
123.5bp
167.3bp
ROE
17.2
17.0
17.2
19.4
15.8
18.4
257.6bp
141.2bp
Calc -Yield - AUM
15.16
15.29
15.25
14.77
15.18
15.34
15.8bp
4.9bp
Calc -Yield - Advance
18.31
18.40
18.42
18.13
18.86
19.42
56.1bp
101.5bp
Calc - COF
9.02
8.59
8.74
8.74
9.14
9.17
2.8bp
58.1bp
Spread
9.3
9.8
9.7
9.4
9.7
10.3
53.3bp
43.4bp
Exhibit 3: Break Up
Particular (` cr)
1QFY19
2QFY19
3QFY19
4QFY19
Q1FY20
Q2FY20
% QoQ
% YoY
New
12,140
12,719
12,077
11,594
11,450
10,967
(4)
(14)
Used
83,919
86,057
86,126
87,050
89,021
91,215
2
6
Business Loan
2,978
3,314
3,182
2,971
2,912
2,852
(2)
(14)
Working Capital
1,895
2,171
2,365
2,807
2,898
3,027
4
39
Others
46
119
68
60
62
60
(3)
(50)
Total AUM
1,00,978
1,04,380
1,03,818
1,04,482
1,06,343
1,08,120
2
4
Source: Company, Angel Research
3
Quarterly results | Q2FY2020 Result Update
Oct 30, 2019
3
Exhibit 4: Asset Quality & Business Details
Asset Quality
4QFY18
1QFY19
2QFY19
3QFY19
4QFY19
Q1FY20
Q2FY20
% QoQ
% YoY
Credit Cost (Annualized) AUM
0.4
2.1
2.6
2.5
2.1
2.1
2.4
16
(7)
GS 3
9,084
9,157
9,092
9,033
8,623
8,926
9,397
5
3
GS 3 %
9.53
9.11
8.71
8.70
8.25
8.52
8.80
28bp
8.9bp
ECL prov stage 3
3,286
3,118
3,113
3,187
2,967
2,841
3,017
6
(3)
Net Stage 3
5,799
6,039
5,979
5,846
5,656
6,085
6,380
5
7
Coverage Ratio Satge 3
36
34
34
35
34
32
32.1
27.8bp
(213.7)bp
GS 1& 2
87,617
91,879
96,173
93,875
94,358
95,889
97,406
2
1
ECL prov stage 1& 2
2,364
2,341
2,604
2,651
2,604
2,762
2,766
0
6
Net Stage 1 & 2
85,253
89,538
93,568
91,224
91,755
93,127
94,639
2
1
ECL Prov (%) Stage 1&2
2.70
2.55
2.71
2.82
2.76
2.88
2.84
(4)bp
13bp
Business Details ()
AUM
95,306
1,00,541
1,04,380
1,03,818
1,04,482
1,06,343
1,08,120
2
4
Disbursement
14,157
13,425
13,799
9,550
11,959
12,300
13,120
7
(5)
New
3,150
2,470
2,300
400
8,100
890
666
(25)
(71)
Old
11,970
10,960
11,510
9,020
11,020
11,260
12,282
9
7
On book Loans
79,673
82,462
87,815
84,533
85,085
84,661
8,477
(90)
(90)
Off book (Securitization)
15,633
18,079
16,565
19,285
17,223
19,750
21,691
10
31
DA
62
38
24
1,721
2,175
1,942
1,657
(15)
6,945
Source: Company, Angel Research
Exhibit 5: 1 year forward P/B
Source: Company, Angel Research
1.28
2.00
2.48
1.52
-
0.50
1.00
1.50
2.00
2.50
3.00
3.50
4.00
Apr-09
Oct-09
Apr-10
Oct-10
Apr-11
Oct-11
Apr-12
Oct-12
Apr-13
Oct-13
Apr-14
Oct-14
Apr-15
Oct-15
Apr-16
Oct-16
Apr-17
Oct-17
Apr-18
Oct-18
Apr-19
Oct-19
P/BV
Avg. P/BV
+1STD
-1STD

4
Quarterly results | Q2FY2020 Result Update
Oct 30, 2019
4
Income Statement
Y/E March ( `cr)
FY17
FY18
FY19
FY20E
FY21E
NII
5,561
6,800
7,808
8,572
9,604
- YoY Growth (%)
10.1
22.3
14.8
9.8
12.0
Other Income
82
215
101
110
122
- YoY Growth (%)
-55.5
162.8
-53.0
8.9
10.6
Operating Income
5,643
7,015
7,909
8,682
9,726
- YoY Growth (%)
7.8
24.3
12.7
9.8
12.0
Operating Expenses
1,275
1,492
1,750
1,977
2,195
- YoY Growth (%)
-5.4
17.0
17.3
13.0
11.0
Pre - Provision Profit
4,368
5,524
6,159
6,705
7,530
- YoY Growth (%)
12.3
26.4
11.5
8.9
12.3
Prov. & Cont.
2,444
1,722
2,382
2,430
2,568
- YoY Growth (%)
16.0
-29.5
38.3
2.0
5.7
Profit Before Tax
1,924
3,801
3,776
4,275
4,963
- YoY Growth (%)
8.0
97.6
-0.7
13.2
16.1
Prov. for Taxation
667
1,341
1,214
1,118
1,249
- as a % of PBT
34.6
35.3
32.1
26.2
25.2
PAT
1,257
2,460
2,562
3,157
3,713
- YoY Growth (%)
6.7
95.7
4.2
23.2
17.6
Balance Sheet
Y/E March ( `cr)
FY17
FY18
FY19
FY20E
FY21E
Share Capital
227
227
227
227
227
Reserve & Surplus
11,075
13,349
15,609
18,446
21,783
Net worth
11,302
13,576
15,836
18,673
22,010
Borrowing
53,110
82,131
87,968
95,885
1,06,432
- YoY Growth (%)
6.7
54.6
7.1
9.0
11.0
Other Liab. & Prov.
9,998
1,539
1,487
1,040
489
Total Liabilities
74,410
97,245
1,05,291
1,15,598
1,28,932
Investment
1,549
2,341
3,999
3,999
3,999
Cash
4,441
3,675
3,981
4,571
5,077
Advance
65,463
90,738
96,751
1,06,426
1,19,197
- YoY Growth (%)
5.8
38.6
6.6
10.0
12.0
Fixed Asset
84
120
147
154
162
Other Assets
2,874
383
413
448
497
Total Asset
74,410
97,245
1,05,291
1,15,598
1,28,932
Growth (%)
9.5
30.7
8.3
9.8
11.5

5
Quarterly results | Q2FY2020 Result Update
Oct 30, 2019
5
Exhibit 6: Key Ratio
Y/E March
FY17
FY18
FY19
FY20E
FY21E
Profitability ratios (%)
NIMs
8.5
8.5
8.1
8.1
8.2
Cost to Income Ratio
22.6
21.3
22.1
22.8
22.6
RoA
1.8
2.9
2.5
2.9
3.0
RoE
11.7
19.8
17.4
18.3
18.3
Asset Quality (%)
Gross NPAs
8.20
9.15
8.3
8.0
7.5
GNPA (` Cr)
5,408
7,376
7,100
8,514
8,940
Net NPAs (%)
2.7
2.83
2.6
2.4
2.4
NPA (` Cr)
1,659
2,131
2,055
2,554
2,861
Provision Coverage
67.1
69.1
69.2
70.0
68.0
Credit Cost (AUM)
3.1
1.8
2.3
2.0
1.9
Per Share Data (`)
FY17
FY18
FY19
FY20E
FY21E
EPS
55
108
113
139
164
ABVPS
425
504
607
710
844
DPS
10
11
11
14
17
BVPS
498
598
698
823
970
Valuation Ratios
PER (x)
20.7
10.6
10.2
8.2
7.0
P/ABVPS (x)
2.3
1.9
1.6
1.4
1.2
P/BVPS
2.3
1.9
1.6
1.4
1.2
Dividend Yield
0.9
1.0
1.0
1.2
1.4
DuPont Analysis
FY17
FY18
FY19
FY20E
FY21E
NII
7.8
7.9
7.7
7.8
7.9
(-) Prov. Exp.
3.4
2.0
2.4
2.2
2.1
Adj. NII
4.4
5.9
5.4
5.6
5.8
Other Inc.
0.1
0.3
0.1
0.1
0.1
Op. Inc.
4.5
6.2
5.5
5.7
5.9
Opex
1.8
1.7
1.7
1.8
1.8
PBT
2.7
4.4
3.7
3.9
4.1
Taxes
0.9
1.6
1.2
1.0
1.0
RoA
1.8
2.9
2.5
2.9
3.0
Leverage
6.6
6.9
6.9
6.4
6.0
RoE
11.7
19.8
17.4
18.3
18.3
Valuation done on closing price of 29/10/2019

6
Quarterly results | Q2FY2020 Result Update
Oct 30, 2019
6
Research Team Tel: 022 - 39357800 E-mail: [email protected] Website: www.angelbroking.com
DISCLAIMER:
Angel Broking Limited (hereinafter referred to as “Angel”) is a registered Member of National Stock Exchange of India Limited,
Bombay Stock Exchange Limited, Metropolitan Stock Exchange Limited, Multi Commodity Exchange of India Ltd and National
Commodity & Derivatives Exchange Ltd It is also registered as a Depository Participant with CDSL and Portfolio Manager and
Investment Adviser with SEBI. It also has registration with AMFI as a Mutual Fund Distributor. Angel Broking Limited is a
registered entity with SEBI for Research Analyst in terms of SEBI (Research Analyst) Regulations, 2014 vide registration number
INH000000164. Angel or its associates has not been debarred/ suspended by SEBI or any other regulatory authority for
accessing /dealing in securities Market. Angel or its associates/analyst has not received any compensation / managed or co-
managed public offering of securities of the company covered by Analyst during the past twelve months.
This document is solely for the personal information of the recipient, and must not be singularly used as the basis of any
investment decision. Nothing in this document should be construed as investment or financial advice. Each recipient of this
document should make such investigations as they deem necessary to arrive at an independent evaluation of an investment in
the securities of the companies referred to in this document (including the merits and risks involved), and should consult their
own advisors to determine the merits and risks of such an investment.
Reports based on technical and derivative analysis center on studying charts of a stock's price movement, outstanding positions
and trading volume, as opposed to focusing on a company's fundamentals and, as such, may not match with a report on a
company's fundamentals. Investors are advised to refer the Fundamental and Technical Research Reports available on our
website to evaluate the contrary view, if any
The information in this document has been printed on the basis of publicly available information, internal data and other
reliable sources believed to be true, but we do not represent that it is accurate or complete and it should not be relied on as
such, as this document is for general guidance only. Angel Broking Limited or any of its affiliates/ group companies shall not be
in any way responsible for any loss or damage that may arise to any person from any inadvertent error in the information
contained in this report. Angel Broking Limited has not independently verified all the information contained within this
document. Accordingly, we cannot testify, nor make any representation or warranty, express or implied, to the accuracy,
contents or data contained within this document. While Angel Broking Limited endeavors to update on a reasonable basis the
information discussed in this material, there may be regulatory, compliance, or other reasons that prevent us from doing so.
This document is being supplied to you solely for your information, and its contents, information or data may not be
reproduced, redistributed or passed on, directly or indirectly.
Neither Angel Broking Limited, nor its directors, employees or affiliates shall be liable for any loss or damage that may arise
from or in connection with the use of this information.
Neither Angel Broking Limited, nor its directors, employees or affiliates shall be liable for any loss or damage that may arise
from or in connection with the use of this information..
Neither Angel Broking Pvt. Limited, nor its directors, employees or affiliates shall be liable for any loss or
damage that may arise from or in connection with the use of this information.
Disclosure of Interest Statement Shriram Transport Fin
1. Financial interest of research analyst or Angel or his Associate or his relative No
2. Ownership of 1% or more of the stock by research analyst or Angel or associates or relatives No
3. Served as an officer, director or employee of the company covered under Research No
4. Broking relationship with company covered under Research No
Ratings (Based on expected returns Buy (> 15%) Accumulate (5% to 15%) Neutral (-5 to 5%)
Over 12 months investment period): Reduce (-5% to -15%) Sell (< -15)